


Understanding top Command
This post helps understanding top command on Linux. top is a tool that outputs a list of the currently running processes of the system and the output updates in every 3 seconds by default. It also shows CPU load, currently used and free RAM as well as a lot of other useful information.
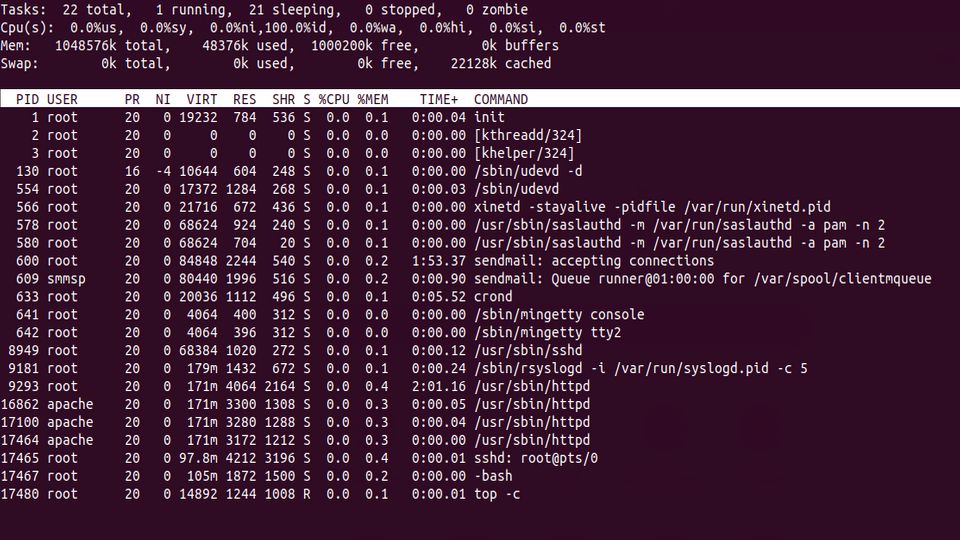
This tool is installed by default in most Linux distributions. I have provided an example output below:
top - 12:14:43 up 92 days,  6:28,  1 user,  load average: 0.00, 0.10, 0.03
Tasks:  22 total,   1 running,  21 sleeping,   0 stopped,   0 zombie
Cpu(s):  0.0%us,  0.0%sy,  0.0%ni,100.0%id,  0.0%wa,  0.0%hi,  0.0%si,  0.0%st
Mem:   1048576k total,    48376k used,  1000200k free,        0k buffers
Swap:        0k total,        0k used,        0k free,    22128k cached

  PID USER      PR  NI  VIRT  RES  SHR S %CPU %MEM    TIME+  COMMAND
    1 root      20   0 19232  784  536 S  0.0  0.1   0:00.04 init
    2 root      20   0     0    0    0 S  0.0  0.0   0:00.00 [kthreadd/324]
    3 root      20   0     0    0    0 S  0.0  0.0   0:00.00 [khelper/324]
  130 root      16  -4 10644  604  248 S  0.0  0.1   0:00.00 /sbin/udevd -d
  554 root      20   0 17372 1284  268 S  0.0  0.1   0:00.03 /sbin/udevd
Interactive commands
Before proceeding to explain every field in the output of top command, please read about the interactive commands used in top.
| Key | Name | function |
| u | User | Filter a user’s processes |
| k | kill | End process |
| r | renice | Set process Nice value |
| d | delay | Set update interval in seconds |
| n | number | Maximum number of displayed processes |
| N | Number | Sort by PID |
| P | Percent | Sort by CPU usage |
| M | Memory | Sort by RAM usage |
| q | quit | Quitting top |
| H | help | Show help |
Also, pressing the space bar refreshes the screen output.
Understanding top command: Summary Area
1st Row — top
This line shows the time since the system was online. It also shows the load averages of last 1, 5 and 15 minutes.
top - 12:14:43 up 92 days, 6:28, 1 user, load average: 0.00, 0.10, 0.03
Understand each sections in 1st row in order:
- Current time – 12:14:43
- Uptime – 92 days, 6:28
- Currently logged in Users – 1 user
- Average load – load average: 0.00, 0.10, 0.03 (The 3 values refer to the last minute, five minutes and 15 minutes)
2nd Row – task
Displays the number of processes active at the time of the last update. It also shows how many processes are running, sleeping, stopped or undead
Tasks: 22 total, 1 running, 21 sleeping, 0 stopped, 0 zombie
Understand each sections in 2nd row in order:
- Total Processes – 22 total
- Running Processes – 1 running
- Sleeping Processes – 21 sleeping
- Stopped Processes – 0 stopped
- Zombie Processes – 0 zombie
Zombie Processes: Zombie process also known as defunct process is a process that finished the execution but it still has an entry in the process table to report to its parent process.
3rd Row – Cpu(s)
This section displays the CPU utilization in percent.
Cpu(s): 0.0%us, 0.0%sy, 0.0%ni,100.0%id, 0.0%wa, 0.0%hi, 0.0%si, 0.0%st
Understand each sections in 3rd row in order:
- Percentage of CPU for user processes – 0.0%us
- Percentage of CPU for system processes – 0.0%sy
- Percentage of CPU processes that have no default priority (nice) – 0.0%ni
- Percentage of CPU not used – 100.0%id
- Percentage of CPU processes waiting for I/O operations – 0.0%wa
- Percentage of CPU serving hardware interrupts – 0.0% hi – Hardware IRQ
- Percentage of CPU serving software interrupts – 0.0% si – Software Interrupts
- Percentage of Steel Time – 0.0%st – Steal Time
Steal time is the percentage of time a virtual CPU waits for a real CPU while the hypervisor is servicing another virtual processor.
4th and 5th Row – Memory usage
This section shows the statistics on the utilization of the main memory and also displays the swap utilization.
Mem:   1048576k total,    48376k used,  1000200k free,        0k buffers
Swap:        0k total,        0k used,        0k free,    22128k cached
The above rows shows the usage of RAM and swap in the order Total memory, Memory in use, Free memory and buffers cached.
All Other rows: Processes list
PID USER      PR  NI  VIRT  RES  SHR S %CPU %MEM    TIME+  COMMAND
  1 root      20   0 19232  784  536 S  0.0  0.1   0:00.04 init
  2 root      20   0     0    0    0 S  0.0  0.0   0:00.00 [kthreadd/324]
  3 root      20   0     0    0    0 S  0.0  0.0   0:00.00 [khelper/324]
130 root      16  -4 10644  604  248 S  0.0  0.1   0:00.00 /sbin/udevd -d
- PID – This is the ID of a process.
- USER – The owner of the process
- PR – priority of the process
- NI – NICE value of the process
- VIRT – Virtual memory used by process
- RES – Physical memory used by a process
- SHR – Shared memory of the process
- S – Status of the process. The Different status’ are given below:
S - sleeping
D - uninterruptible sleep
R - running
W - swapped out process
Z - zombies
I - Ideal process
T - stopped or traced
N - process with positive nice value
< - process with negative nice value
- %CPU – Percentage of CPU used a process
- %MEM – Percentage of RAM used a process
- TIME+ – The total time of activity of process (0:17.75)
- COMMAND – It shows the exact command or name used by a process.
That’s it!
Also Read:
- Useful Qmail Commands
- Useful Exim Commands
- Useful Postfix commands Linux
- Basic OpenVZ commands
- Install Htop on CentOS/RHEL and Ubuntu
- Install SAR (sysstat) on CentOS
If you like the post Understanding top Command and wish to receive more articles from us, please like our FB page: GrepItOut
Your suggestions and feedbacks will encourage us and help to improve further, please feel free to write your comments.
For more details on our services, please drop us an E-mail at [email protected]


Add Comment